Depending on a destination shipping cost may vary. Free shipping for orders over $450 on items weighting under 20 lbs (certain restrictions apply!) See shipping page for international rates or contact sales@tmatlantic.com
Sold out
Subscribe
Description
Specifications
Accessories
Videos
Application
FAQ
Software
Descripción
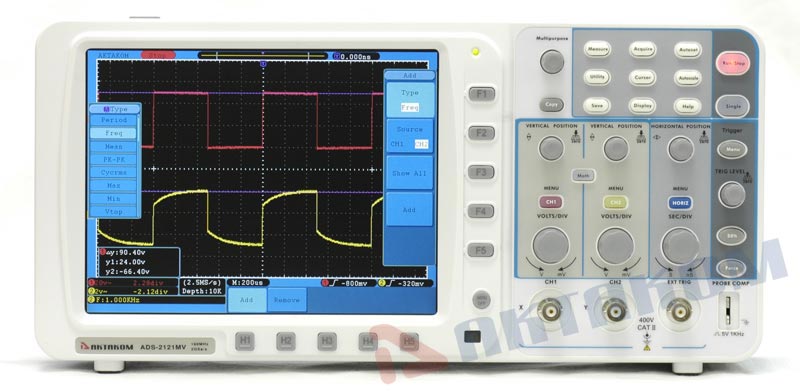
AKTAKOM ADS-2121MV 100MHz bandwidth 2 channel digital storage oscilloscope with a 2GSa/s sample rate and an 8″ color TFT-LCD display with 800x600 resolution offers huge amounts of memory, USB flash storage support and VGA-interface.
ADS-2121MV digital storage oscilloscope is very slim and lightweight. It has a large screen and a convenient carrying handle. Try and fall in love with it! This digital oscilloscope will always give you a hint how to use it. Just press "HELP" and get User Manual on your oscilloscope's screen! It is ideal for learning and if you forgot any oscilloscope's function.
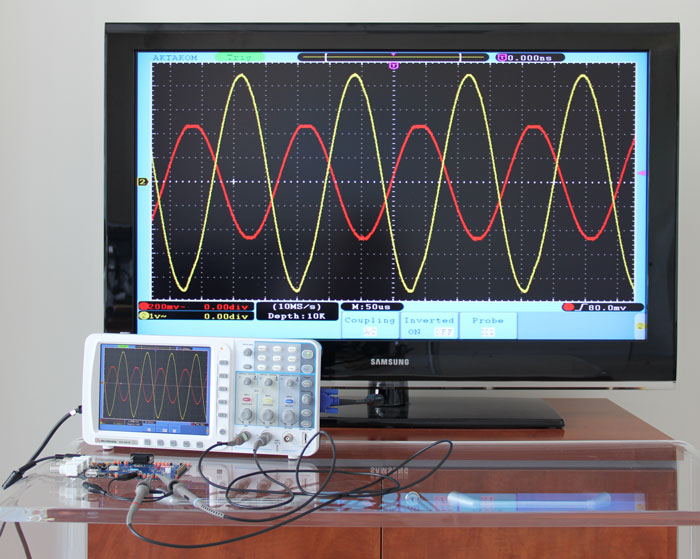
The VGA output that is very helpful to a teacher who wants to demonstrate oscilloscope’s functions on the large screen. ADS-2121MV benchtop digital storage oscilloscope (analog of SDS8102) could be connected to a large screen TV, a projector or any other screen and used for training, presentations and demonstrations. Perfect oscilloscope for education!
About 5V, with the Peak-to-Peak voltage equal to or greater than 1MΩ of load.
Frequency (Typical)
Square wave of 1kHz
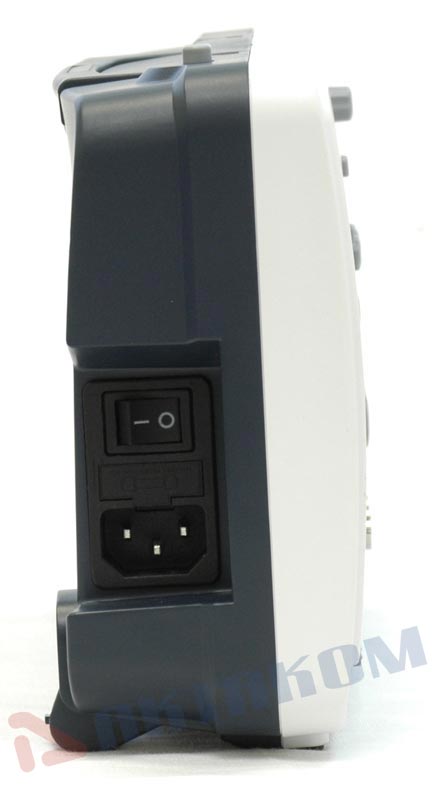
Power
Mains Voltage
100~240VAC RMS, 50/60Hz, CAT II
Power Consumption
<18W
Fuse
1A, T grade, 250V
Battery (optional)
Cell: 558792 4000mAh/3.7V
Pack: 2s2p 7.4V/8000mAh
Environment
Temperature
Working temperature: 0°C~ 40°C
Storage temperature: -20°C~ +60°C
Relative Humidity
≤90%
Height
Operating: 3,000m
Non-operating: 15,000m
Cooling Method
Natural convection
Mechanical Specifications
Dimension
340x155x70mm (LxHxW)
Weight
About 1.82kg
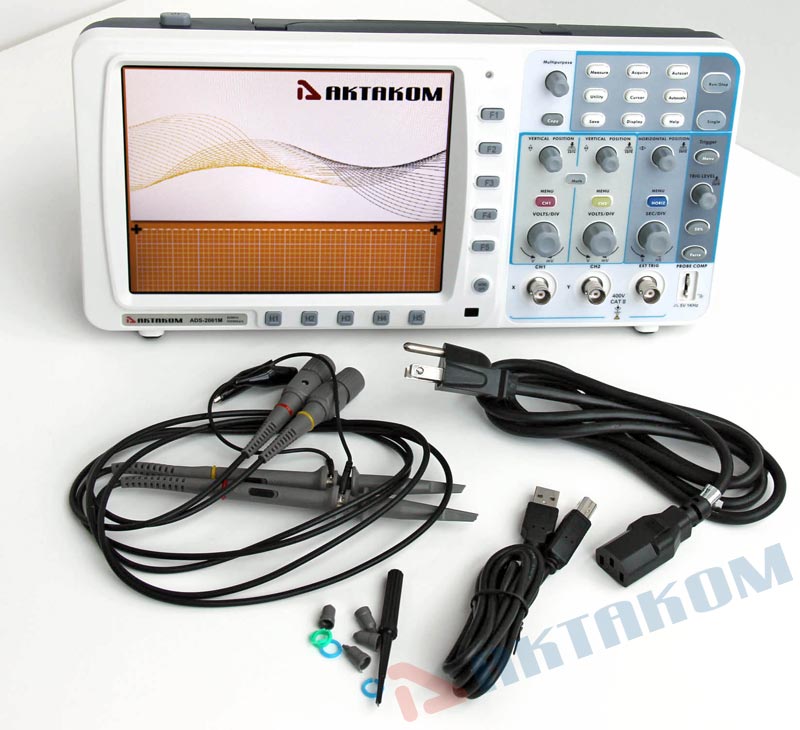
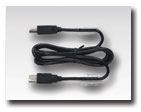
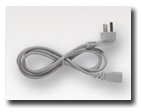
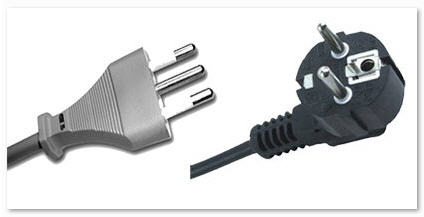
Included accessories
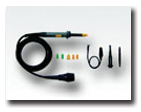
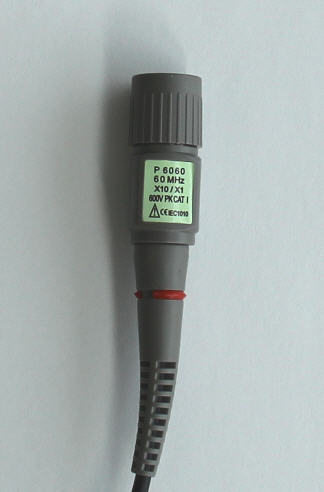
Probes x2
USB cable
Power cord
User's Manual is not included.
You can see it on your oscilloscope's screen by pressing HELP
or download from this page of the site.
Optional accessories
The software in the standard package of the device has no physical media (CD) and can be downloaded at www.tmatlantic.com after the purchasing and registering the equipment with a serial number. This software is paid-for and its cost is included into device value. In the new version of the software, when connecting the unit for the first time, it will ask for a license (access key). It is available online after product registration. Insert the entire character set by coping and pasting it from www.tmatlantic.com. Follow the instructions on the site. We recommend that you make and keep a copy of the downloaded software. Follow our websites news releases to receive software updates.
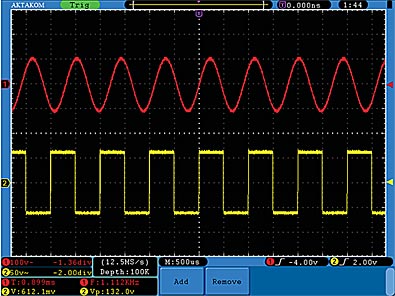
Observe an unknown signal in the circuit, and display and measure rapidly the frequency and peak-to-peak voltage of the signal.
1. Carry out the following operation steps for the rapid display of this signal:
Set the probe menu attenuation coefficient as 10X and that of the switch in the probe switch as 10X
Connect the probe of Channel 1 to the measured point of the circuit.
Push down the Autoset button.
The oscilloscope will implement the Autoset to make the waveform optimized, based on which, you can further regulate the vertical and horizontal divisions till the waveform meets your requirement.
2. Perform Automatic Measurement
The oscilloscope can measure most of the displayed signals automatically. To measure the period and frequency of the Channel 1 and the mean and peak-to-peak voltage of the Channel 2, follow below steps:
Press the Measure button to show the automatic measurement function menu.
Press the H1 to display the Add menu.
Press the F2 button to choose CH1 as the source.
Press the F1 button, the type items will display at the left of screen, and turn the M knob to choose Period.
Press the F4 button, the period measurement will be added.
Press the F1 button again, the type items will display at the left of screen, and turn the M knob to choose Freq.
Press the F4 button, the frequency measurement will be added, finish settings of channel 1.
Press the F2 button to choose CH2 as the source.
Press the F1 button, the type items will display at the left of screen, and turn the M knob to choose Mean.
Press the F4 button, the mean measurement will be added.
Press the F1 button, the type items will display at the left of screen, and turn the M knob to choose PK-PK.
Press the F4 button, the peak-to-peak voltage measurement will be added, finish settings of channel 2.
Then, the period, frequency, mean and peak-to-peak voltage will be displayed at the bottom left of the screen and change periodically
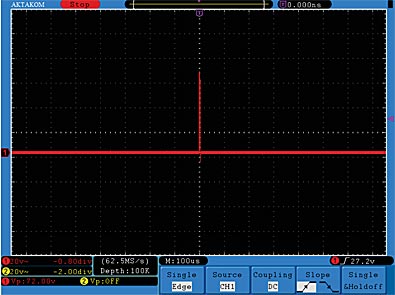
Capture the Single Signal
The digital storage oscilloscope takes the lead in providing the convenience capturing of such non-periodic signals as pulse and burr, etc. If you intent to capture a single signal, you cannot set the trigger level and the trigger edge unless you have particular prior knowledge of this signal. For example, if the pulse is the logic signal of a TTL level, the trigger level should be set to 2 volts and the trigger edge be set as the rising edge trigger. If it is uncertain as to the signal, you can make an observation of it in advance under the automatic or ordinary mode to determine the trigger level and the trigger edge.
The operation steps are as follows:
Set the probe menu attenuation coefficient to 10X and that of the switch in the probe to 10X
Adjust the VOLTS/DIV and SEC/DIV knobs to set up a proper vertical and horizontal ranges for the signal to be observed.
Press the Acquire button to display the Acquire menu.
Press the H1 button to display the Acquire Mode menu.
Press the F2 button to choose Peak detect.
Press the Trigger Menu button to display the Trigger menu.
Press the H1 button to display the Trigger Type menu.
Press the F1 to choose Single as the type.
Turn the M knob to choose Edge as the mode.
Press the H2 button to display the Source menu.
Press the F1 button to choose CH1 as the source.
Press the H3 button to display the Coupling menu; press the F2 button to choose DC as the Coupling.
Press the H4 button to choose (rising) as the Slope.
Rotate the TRIG LEVEL knob and adjust the trigger level to the mid-value of the signal to be measured.
If the Trigger State Indicator at the top of the screen does not indicate Ready, push down the Run/Stop button and start acquiring, waiting the emergence of the signal in conformity with the trigger conditions. If a signal reaches to the set trigger level, one sampling will be made and then displayed in the screen. With this function, any random occurrence can be captured easily. Taking the burst burr of larger amplitude for example, set the trigger level to the value just greater than the normal signal level, and then presses the Run/Stop button and waits. When there is a burr occurring, the instrument will trigger automatically and record the waveform generated during the period around the trigger time. With the HORIZONTAL POSITION knob in the horizontal control area in the panel rotated, you can change the horizontal position of the trigger position to obtain the negative delay, making an easy observation of the waveform before the burr occurs.
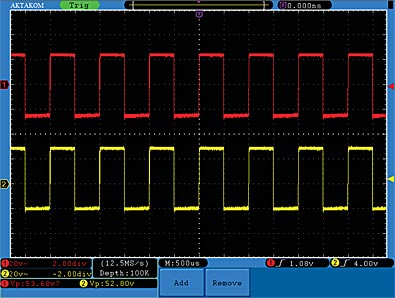
Measuring Gain of the Amplifier in the Metering Circuit
Set the probe menu attenuation coefficient as 10X and that of the switch in the probe as 10X.
Connect the oscilloscope CH1 channel with the circuit signal input end and the CH2 channel to the output end.
Operation Steps:
Push down the Autoset button and the oscilloscope will automatically adjust the waveforms of the two channels into the proper display state.
Push down the Measure button to show the Measure menu.
Press the H1 button.
Press the F2 button and choose CH1.
Press the F1 button and turn the M knob to choose PK-PK.
Press the F2 button and choose CH2.
Press the F1 button again and turn the M knob to choose PK-PK
Read the peak-to-peak voltages of Channel 1 and Channel 2 from the bottom left of the screen
Calculate the amplifier gain with the following formulas.
Gain = Output Signal / Input signal
Gain (db) = 20•log (gain)
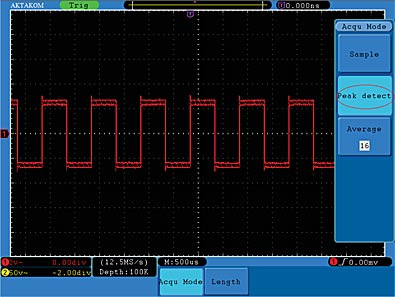
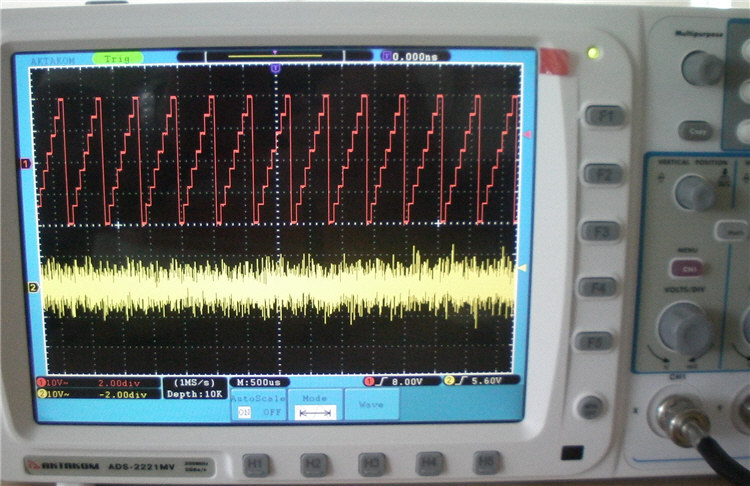
Analyze the Details of a Signal
Observe the Signal Containing Noises
If the signal is interfered by the noise, the noise may cause a failure in the circuit. For the analyzing of the noise in detail, please operate the instrument according to the following steps:
Press the Acquire button to display the Acquire menu.
Press the H1 button to display ACQU Mode menu.
Press the F2 button to choose Peak detect.
In this case, the screen display contains the waveform of a random noise. Especially when the time base is set as Low Speed, then noise peak and burr contained in the signal can be observed with the peak detection.
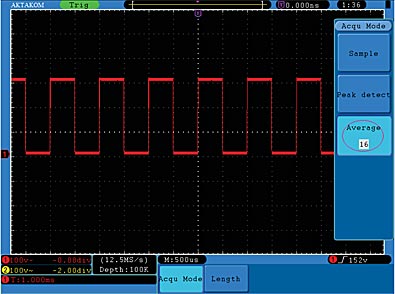
Separate Noises from the Signal
When analyze the waveform of a signal, you should remove the noise in it. For the reduction of the random noise in the oscilloscope display, please operate the instrument according to the following steps:
Press the Acquire button to display the Acquire menu.
Press the H1 button to display ACQU Mode menu.
Press the F3 button, turn the M knob and observe the waveform obtained from averaging the waveforms of different average number.
After the averaging, the random noise is reduced and the detail of the signal is easier to be observed. Shown as follows, after the noise is removed, the burrs on the rising and falling edges appear.
Application of X-Y Function
Examine the Phase Difference between Signals of two Channels
Example: Test the phase change of the signal after it passes through a circuit network.
Connect the oscilloscope with the circuit and monitor the input and output signals of the circuit.
For the examination of the input and output of the circuit in the form of X-Y coordinate graph, please operate according to the following steps:
Set the probe menu attenuation coefficient for 10X and that of the switch in the probe for 10X.
Connect the probe of channel 1 to the input of the network and that of Channel 2 to the output of the network.
Push down the Autoset button, with the oscilloscope turning on the signals of the two channels and displaying them in the screen.
Turn the VOLTS/DIV knob, making the amplitudes of two signals equal in the rough.
Press the Display button and recall the Display menu.
Press the H3 button and choose XY Mode as ON.
The oscilloscope will display the input and terminal characteristics of the network in the Lissajous graph form.
Turn the VOLTS/DIV and VERTICAL POSITION knobs, optimizing the waveform.
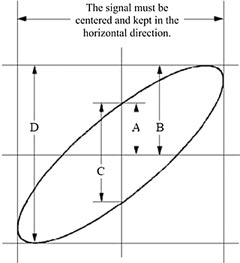
With the elliptical oscillogram method adopted, observe and calculate the phase difference.
Based on the expression sin q=A/B or C/D, there into, q is the phase difference angle, and the definitions of A, B, C, and D are shown as the graph above. As a result, the phase difference angle can be obtained, namely, q =± arcsin (A/B) or ± arcsin (C/D). If the principal axis of the ellipse is in the I and III quadrants, the determined phase difference angel should be in the I and IV quadrants, that is, in the range of (0~π/2) or (3π/2~2π). If the principal axis of the ellipse is in the II and IV quadrants, the determined phase difference angle is in the II and III quadrants, that is, within the range of (π/2~π) or (π~3π/2).
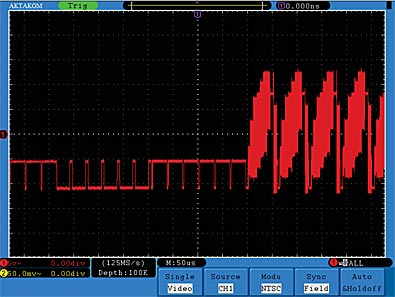
Video Signal Trigger
Observe the video circuit of a television, apply the video trigger and obtain the stable video output signal display.
Video Field Trigger
For the trigger in the video field, carry out operations according to the following steps:
Press the Trigger Menu button to display the trigger menu.
Press the H1 button to display the trigger type menu.
Press the F1 button to choose Single for Type.
Turn the M knob to choose Video as the mode.
Press the H2 button to display the Source menu.
Press the F1 button to choose CH1 for Source.
Press the H3 button to display the Module menu.
Press the F1 button to choose NTSC for the modulation.
Press the H4 button to display the sync menu.
Press the F2 button to choose Field for Sync.
Turn the VOLTS/DIV, VERTICAL POSITION and SEC/DIV knobs to obtain a proper waveform display.
Automatic calibration (auto-calibration) allows you to increase the precision of your oscilloscope operation when the environment temperature is changing. Auto-calibration procedure should be made to achieve the maximum precision of the oscilloscope operation in terms of the environment temperature changing of ≥ 5°C.
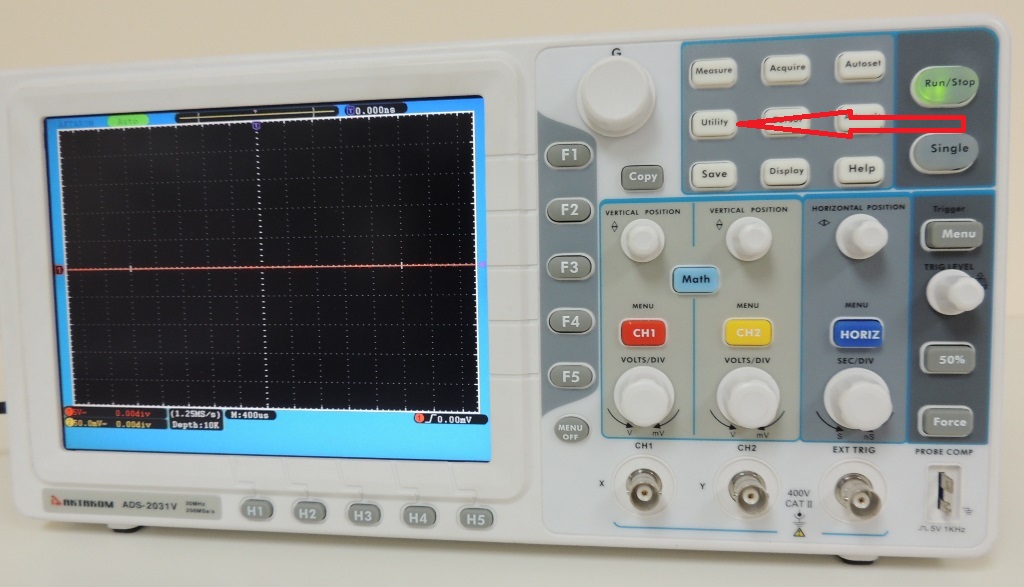
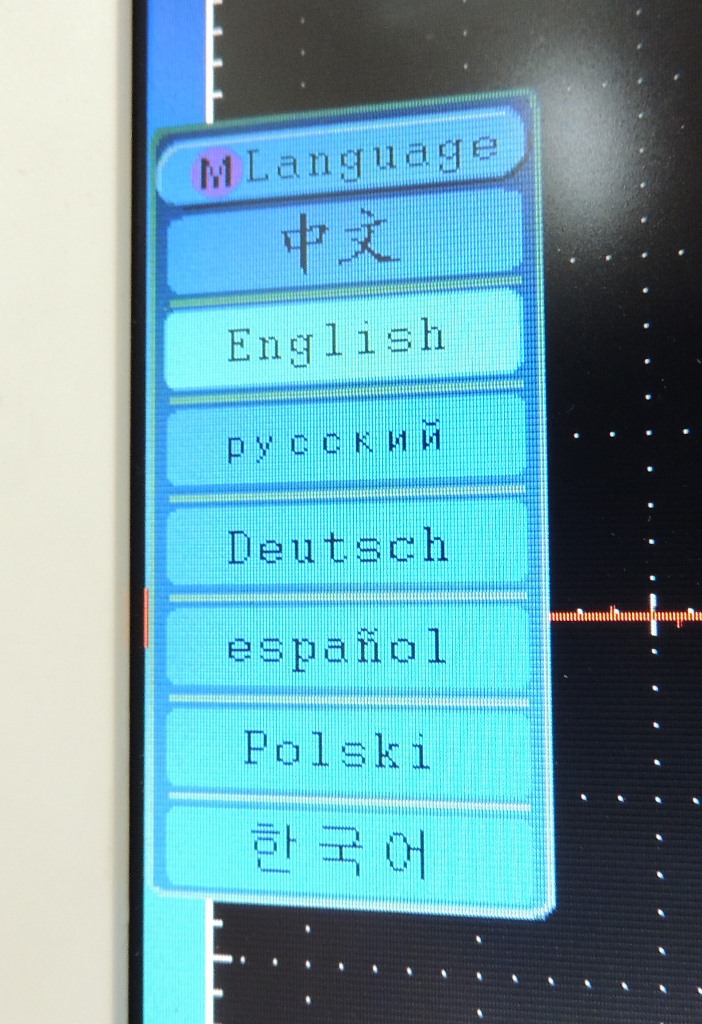
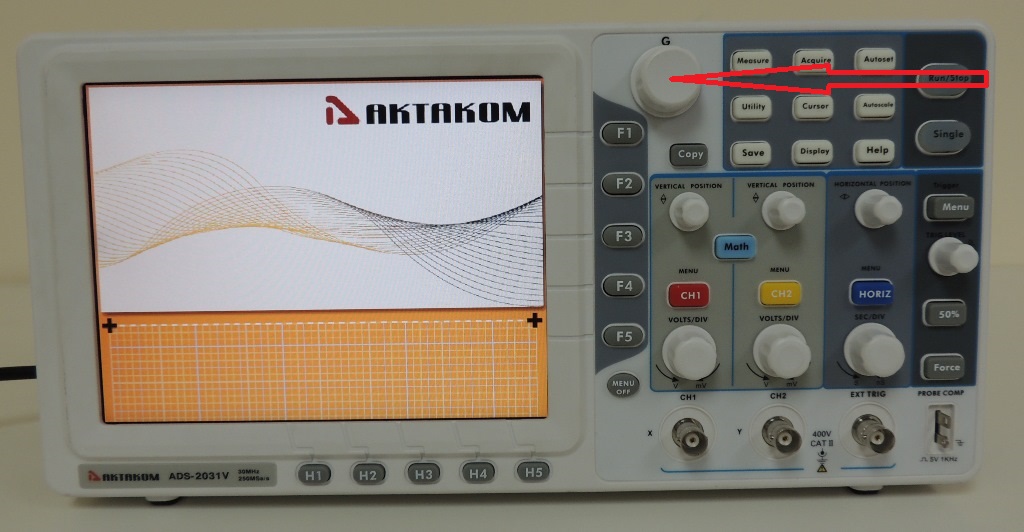
To call auto calibration procedure press UTILITY and then press H1. After that use the rotary switch to select Adjust. Automatic settings menu includes the following items:
Self Cal – call of auto calibration procedure;
Default – call of factory settings (the settings recorded into the device memory).
Auto-calibration procedure looks like as follows:
Before you start auto calibration procedure it’s necessary to disconnect the probes and the cables from the oscilloscope inputs;
Press UTILITY button;
Press H1;
Use the rotary switch to select Adjust;
Press H2. You will see a message window on the oscilloscope display;
Press H 2 button to launch auto calibration procedure or press any other button if you do not want to make auto calibration.
How can oscillogram data be saved for further reading in MS Excel?
Normally the oscilloscope allows saving files to flash memory in *.bmp and *.bin formats. To save oscillogram data for further reading in MS Excel you may use Aktakom DSO-Reader Light or Aktakom DSO-Reader Pro software which saves oscillogram data in AUL format. Saved in AUL format files can be converted (using Aktakom AULFConverter program) into *.csv format that can be read in MS Excel program. For more information refer to Aktakom AULFConverter description. Up
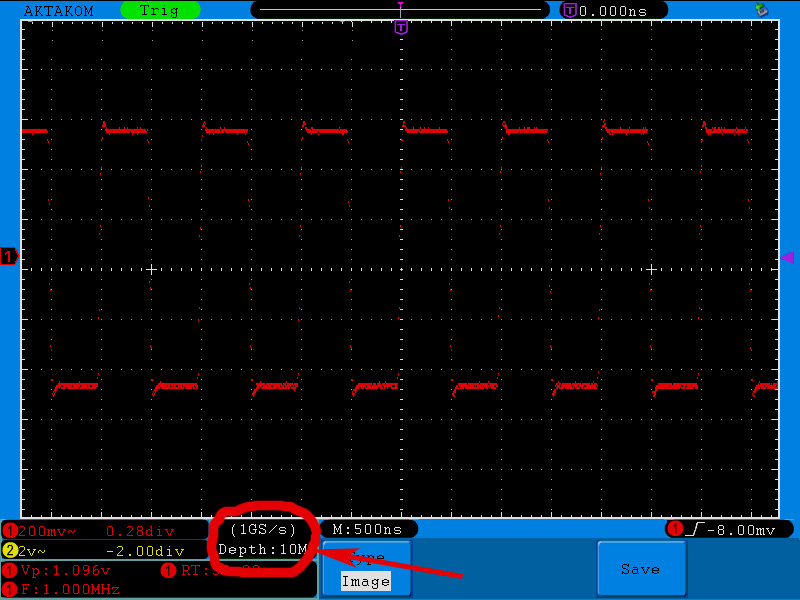
How to check the availability of the specified maximum memory depth (10 Mpts per channel) in ADS-2xxxM/ADS-2xxxMV series oscilloscopes?
Variant 1.
The memory depth can be easily checked in the special area of the device screen.
Variant 2.
You may calculate the memory depth automatically.
1. Apply 1 MHz square signal from the generator to the oscilloscope
2. Press “Auto” button of the oscilloscope to get the stable image.
Here and further on it’s better to operate in the mode of dots signal mapping.
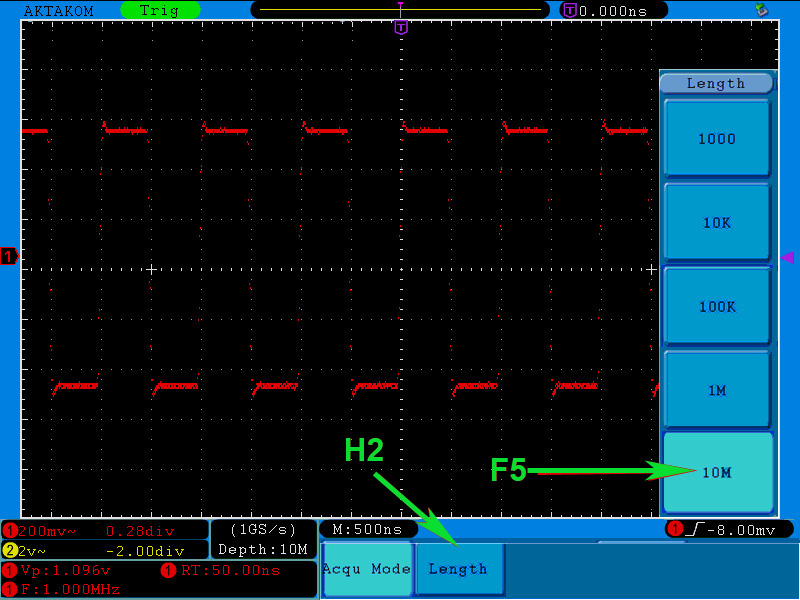
3. Press ACQUIRE button to open the recording main menu. Then press H2 functional button to enter the mode of the memory depth specification and then press F5 to specify the memory depth of 10 Mpts.
4. Stop the signal recording. Therefore press Run/Stop button of the oscilloscope.
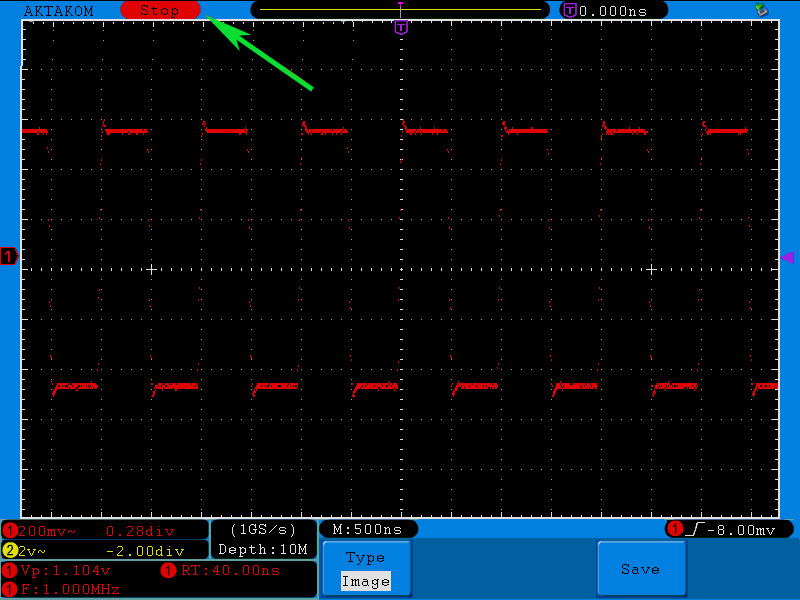
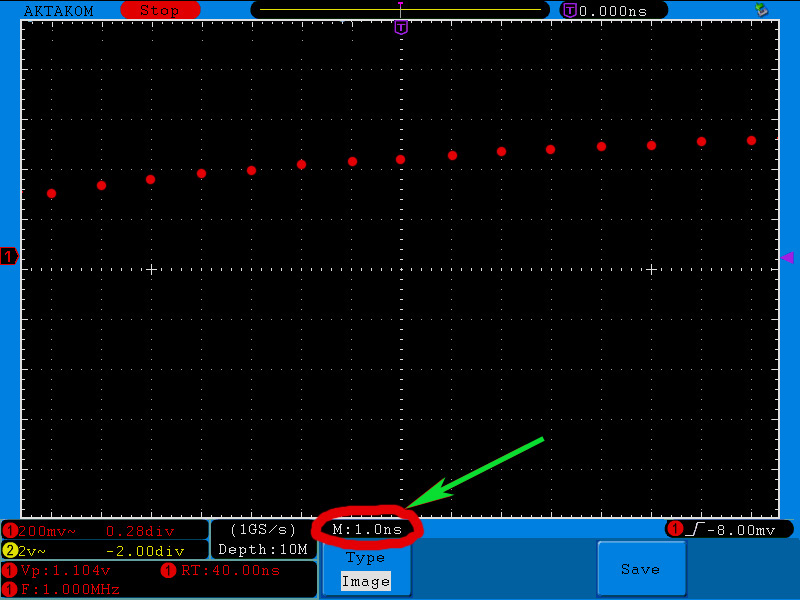
5. Zoom in the oscillogram to see the distance between the points.
In the image you may see that the distance between the points corresponds to 1 division. With 1 ns/div sweep the points are located in 1 ns.
6. Afterwards set the sweep to see the whole captured signal on the display. In our case the best sweep for the whole captured signal display is 5 ms/div.
In this case the captured signal takes 2 divisions meaning that its length is 10 ms.
7. Now you may calculate the quantity of points which can fit in the recorded signal. Therefore divide the recorded signal length of 10 ms by the distance between the points – 1 ns.
Namely: 10 ms/1 ns = 10 Mpts.
Thus you may see that the specified maximum memory depth of AWG series AKTAKOM oscilloscopes is correct – 10 Mpts.
Variant 3.
Memory depth calculation basing on the software.
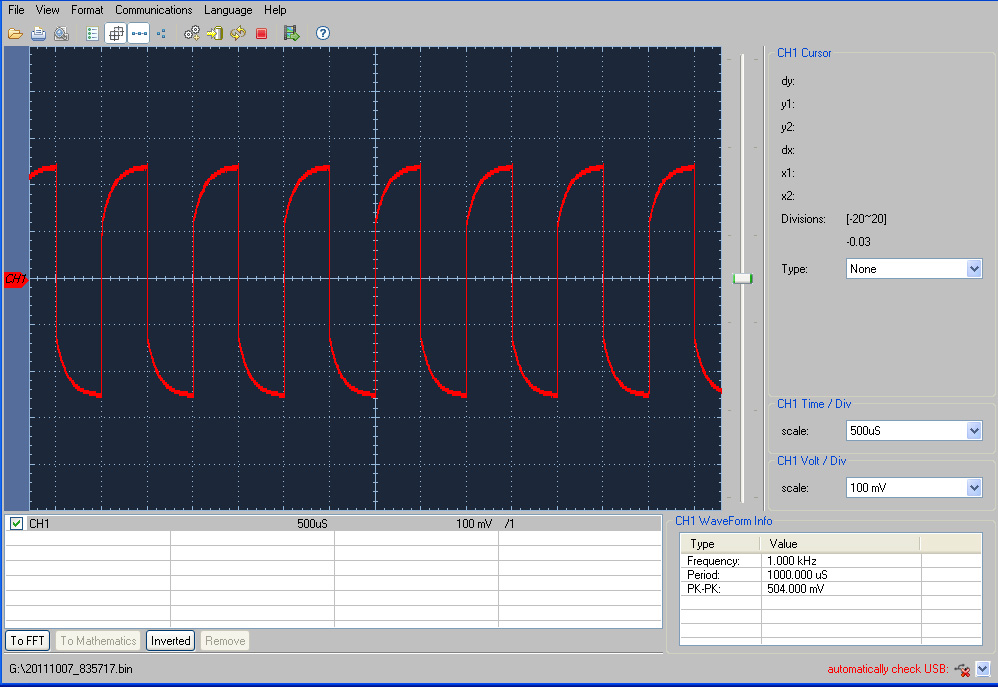
1. Apply a signal to CHA oscilloscope input. You will see the image just like in the picture below:
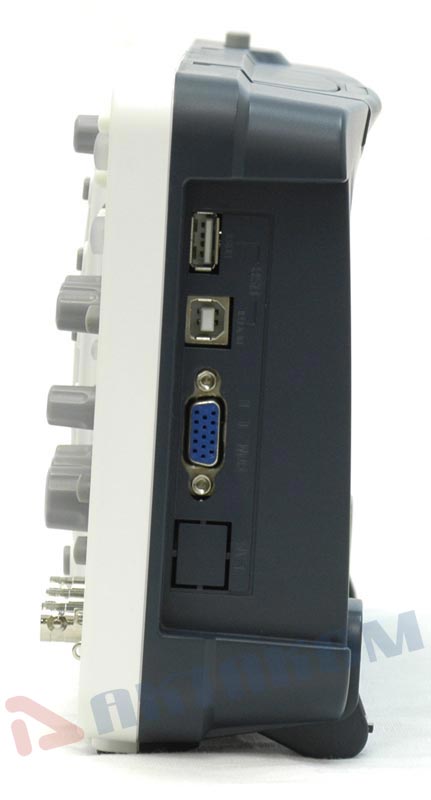
2. Connect a storage device to the USB-port. Save the data on this storage device. Therefore press COPY button. The saving process can take several seconds.
All further data proceeding will be on your PC.
3. In the PC program for the saved data proceeding open “File” tab and then item “Open”. Select the saved file and confirm pressing “Open” key.
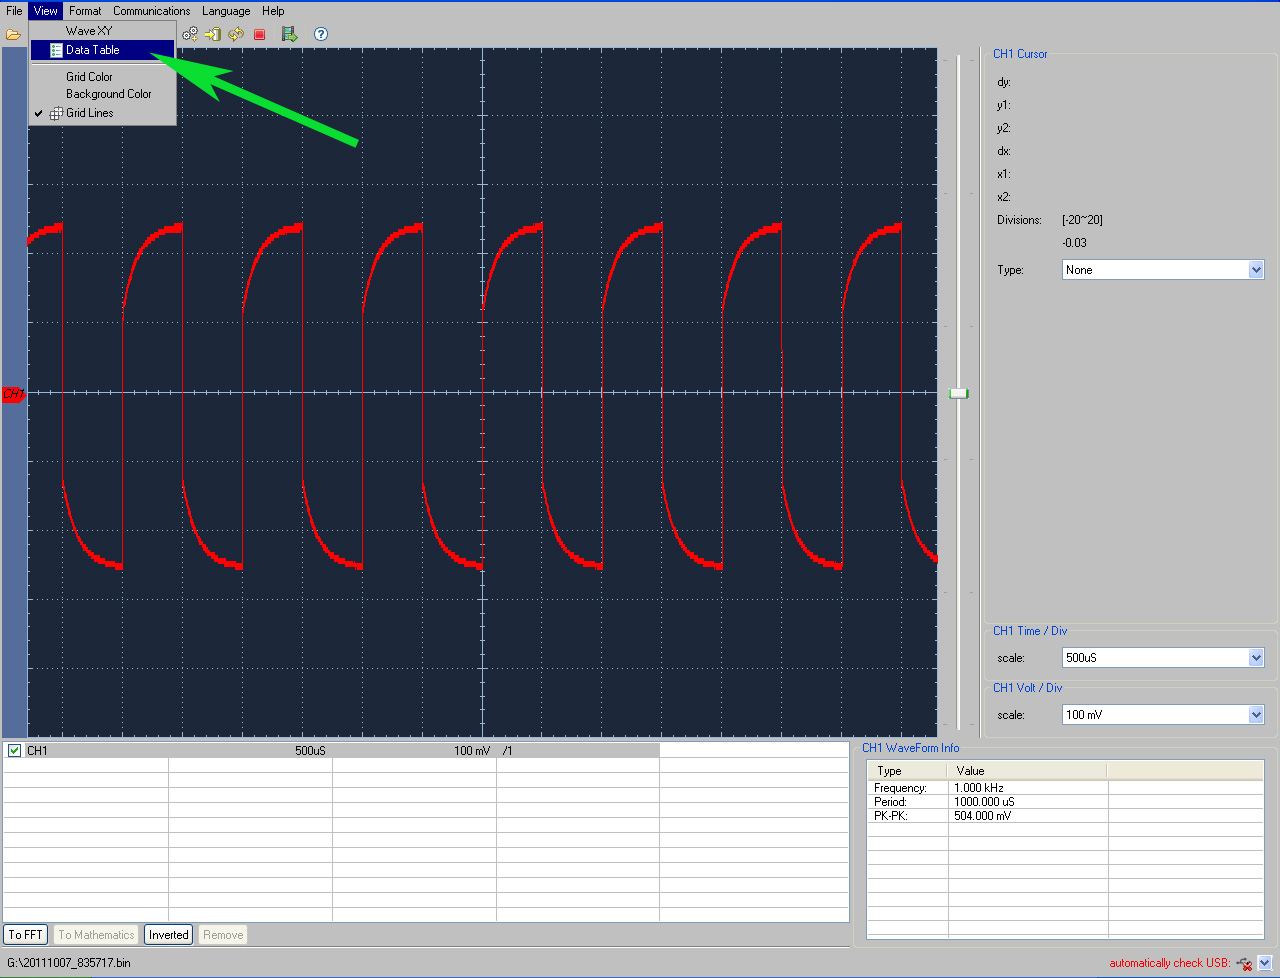
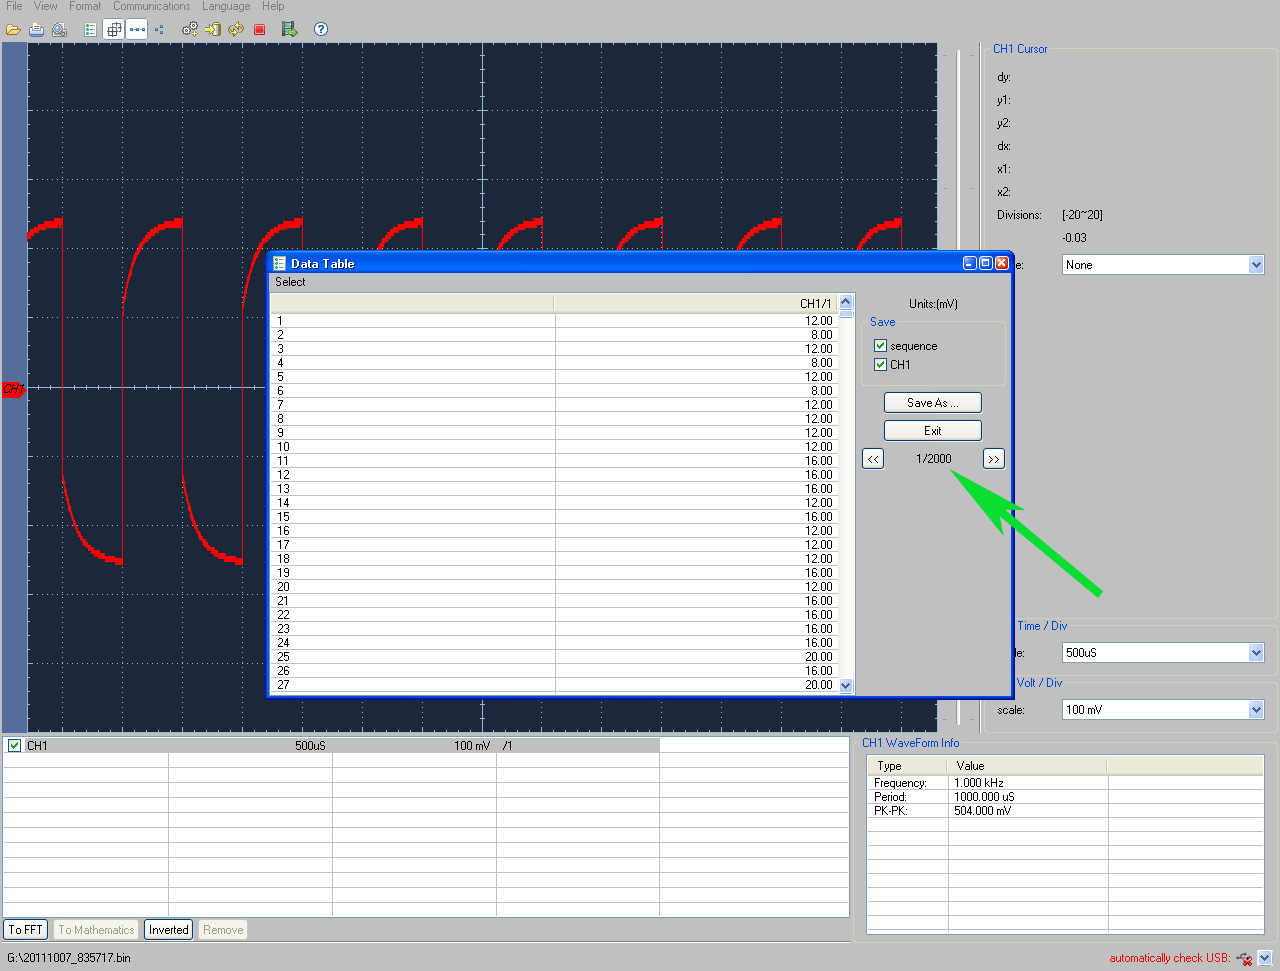
4. Since the aim of this task is to confirm the possibility to save a signal with memory depth of 10 Mpts on the oscilloscope it means that signal data table will be much more convenient comparing to the graphics form. To show the signal as a data table click Data Table icon.
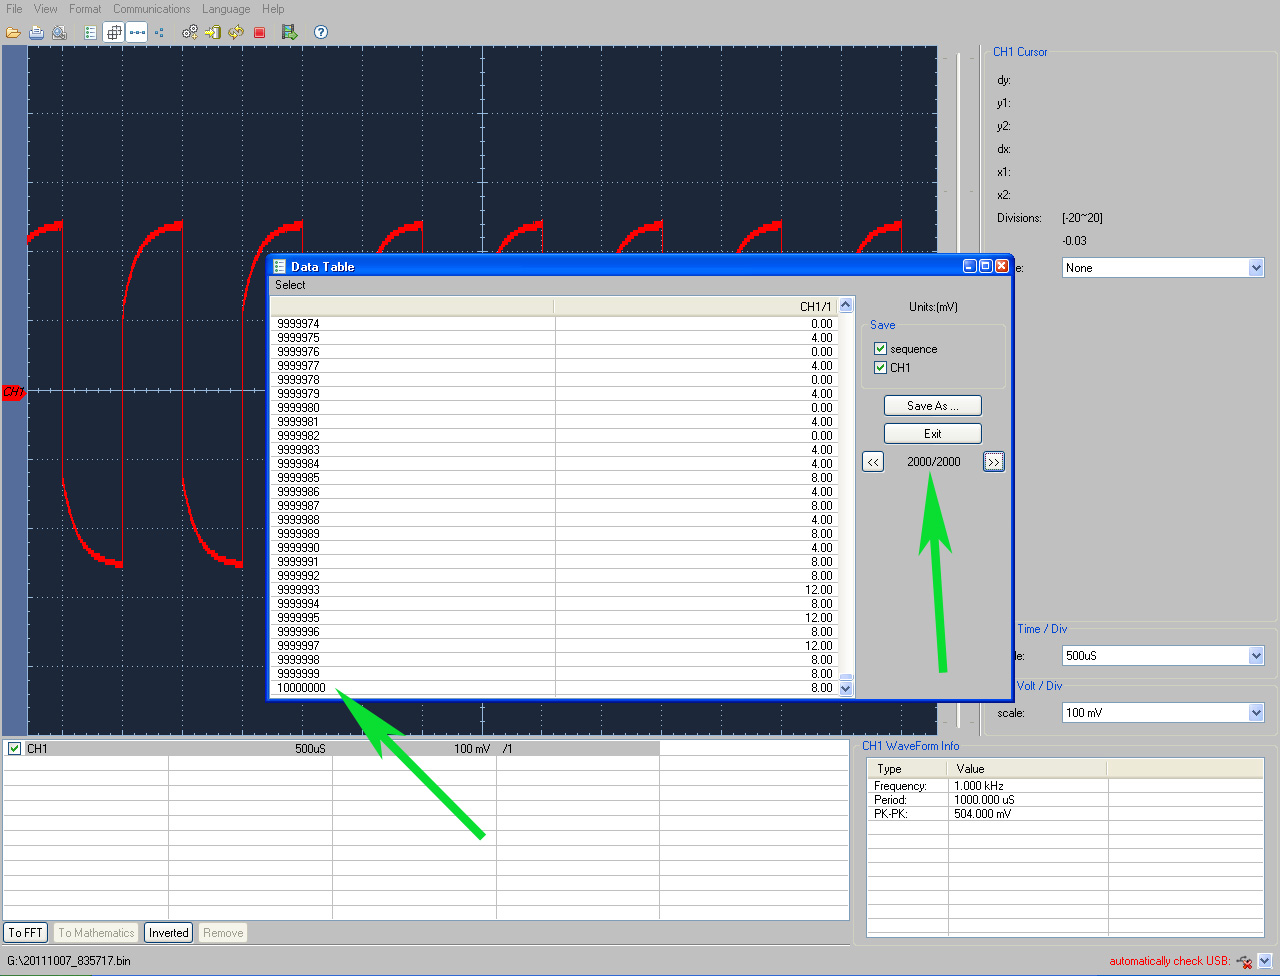
5. You will see the oscilloscope data in a table form (pages from 1 up to 2000).
6. By scrolling the pages up to the last one (with number 2000) you may make sure that the maximum memory depth achieves 10 Mpts/ch.
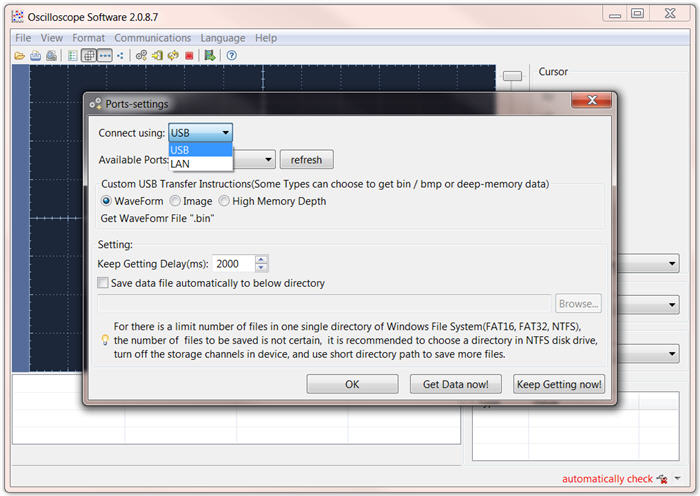
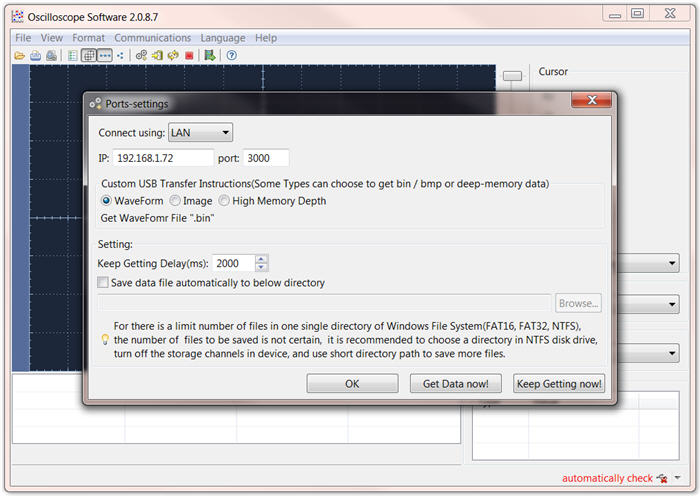
Using your DS-WAVE application software you may connect to your device through LAN. Please follow the example below
then you will be able to type the IP you configured in your device. The factory default IP is 192.168.1.72 but if your LAN range is on a different octave please change the IP and GW in your equipment to the correct mask. The application port is 3000 please don't change it
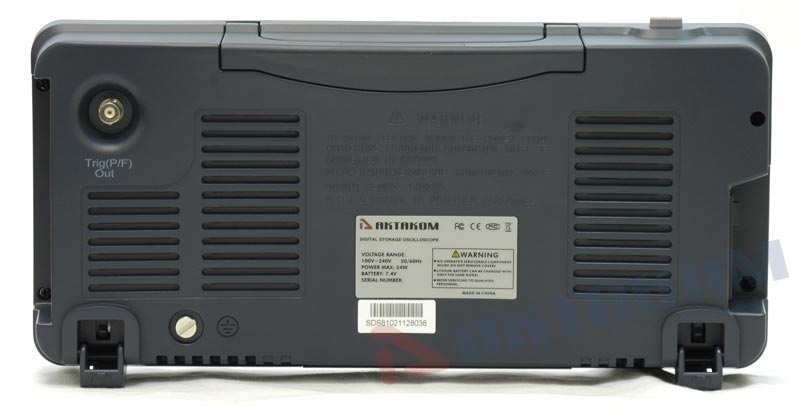
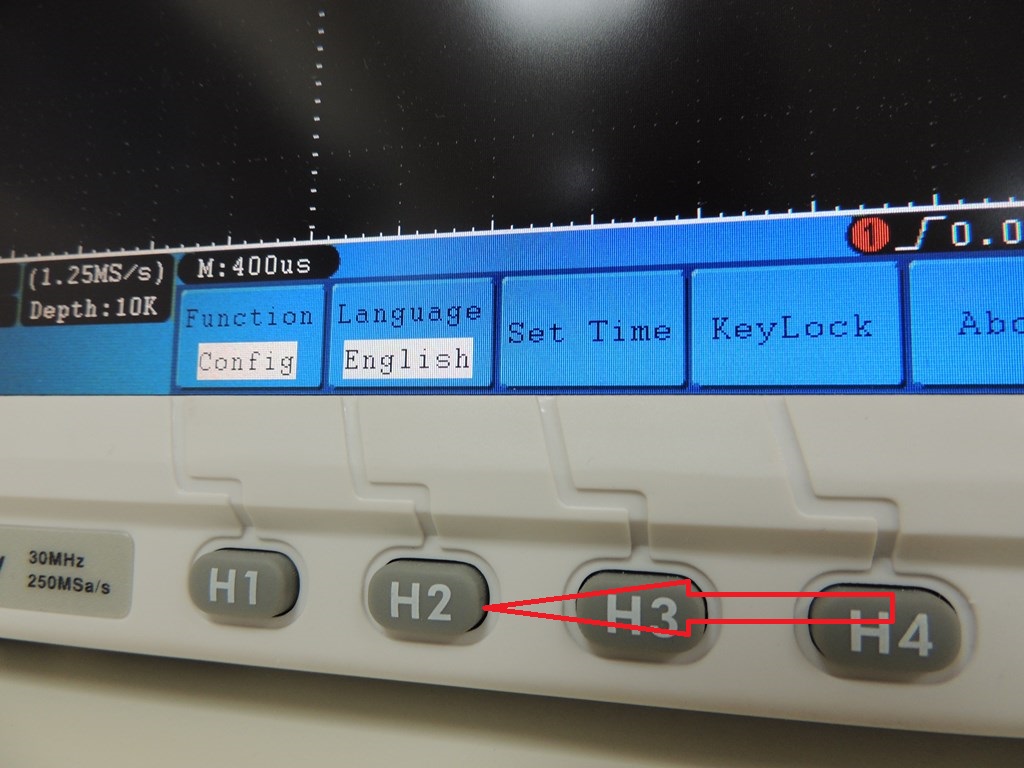
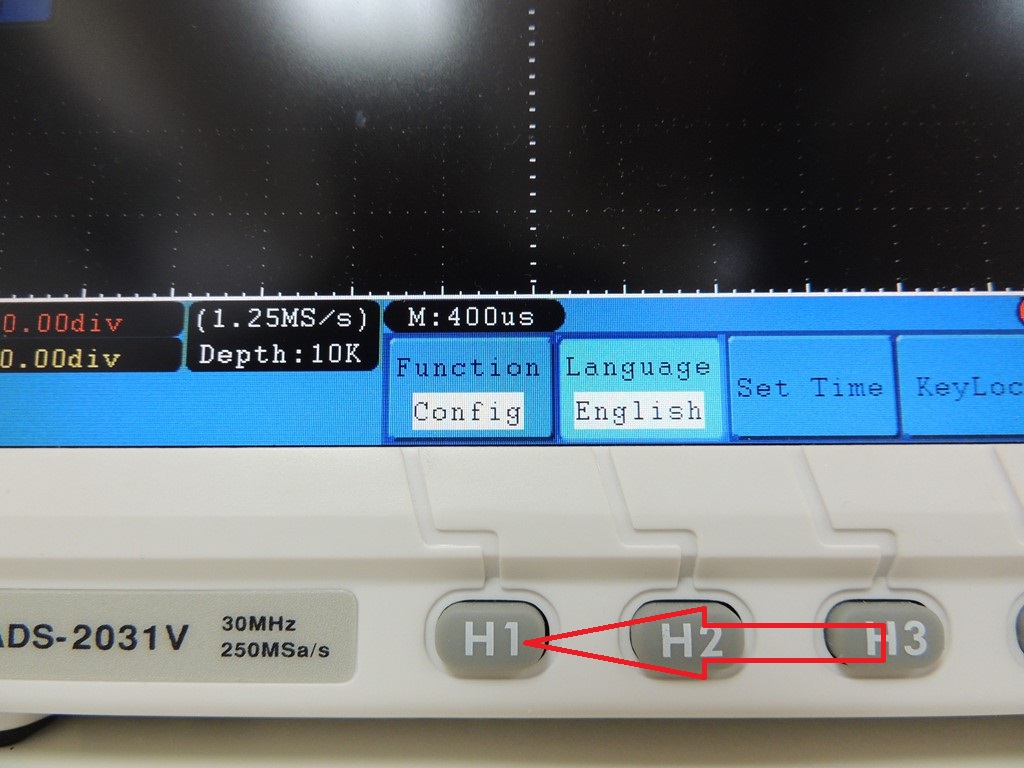
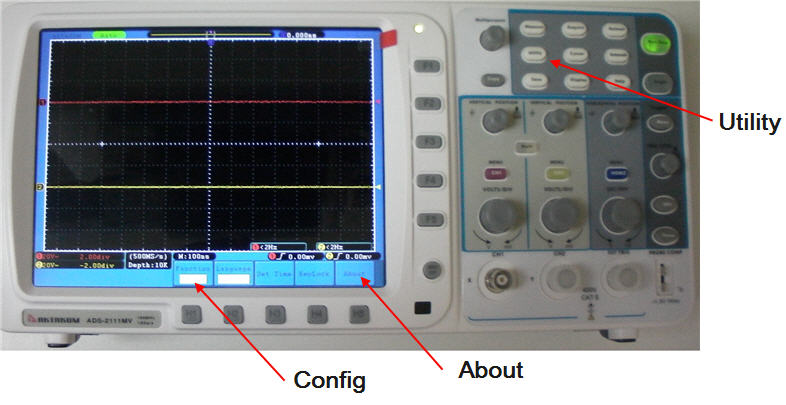
Your serial number is printed in a label with barcode in a back of your oscilloscope as well as in a box but if you want to confirm that number you may press the utility button and go to config (H1) and press about (H5)
During long period of extreme oscilloscope operations with dual channel different signals the use of memory may freeze the equipment instead of switch it off so you may hold last measurement.
Frozen screen in those cases is not a general malfunction instead you do make it run out of memory.
Extreme use of memory is not supported for more than 5 to 10 minutes of permanent measurements
High voltage measurement testing are not allowed over 300 volts
Even when you can read in a probe 600V PK CAT I. The Aktakom, Owon or Rigol oscilloscopes does not support more than 300V RMS or 400V PK. For higher voltage please contact us to request a special device.
The measured voltage amplitude value is 10 times greater or smaller than the actual value
Check whether the channel attenuation coefficient and the attenuation coefficient of the probe used is match. Up
When changing the horizontal sweep on the digital oscilloscope at different horizontal points observed inexplicable change in the form of the same signal, why is this happening?
In fact, this is not a problem.
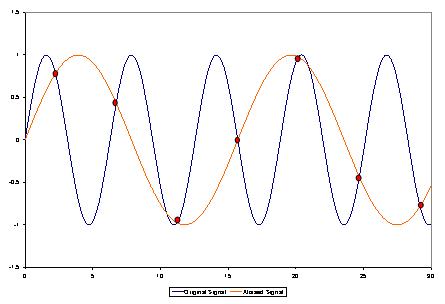
Just keep in mind that you're using a digital oscilloscope, which digitizes the signal with different sampling rates depending on the selected horizontal sweep, and then connects the digitized points with strait line while restoring the real shape of the signal.
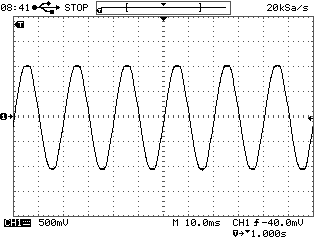
Your first screen shows that you are measuring voltage 50 Hz with the 10 ms / div sweep and a sampling frequency of 20 kHz Ks/s
One signal period (20 ms), digitized in this mode, 20E-03 (sec) * 20E03 (1/sec) = 400 points. This is enough to properly restore and interpolate a sine wave of 50 Hz (i.e. in a period of 20 ms).
Normal display, with a sweep 10 ms / div:
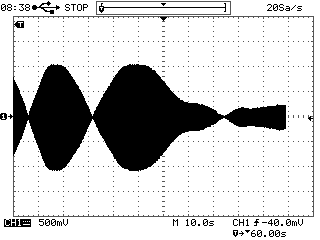
Distortion of the same signal at 10 s / div sweep
Your second screen is set to sweep 10 sec / div, and sample rate on a sweep turned to 20 samples per second (20 Sa / s). I.e. one signal period 20 ms had: 20E-03 (sec) * 20 (1/sec) = 0.4 points. That means that to restore (to interpolate the points) a sine wave with less than one point in time is impossible, so you get this mess (known as "aliasing" or a false frequency) formed by the beats of the measured frequency and sampling frequency.
In order to correctly install a data collection in a digital oscilloscope one should follow a simple rule - the sampling rate must be at least 5-10 times higher than the frequency signal, in that case you will not have the issues that we just discussed.
This applies to all digital oscilloscopes and in no way connected to any particular make or model of oscilloscope or its probes.
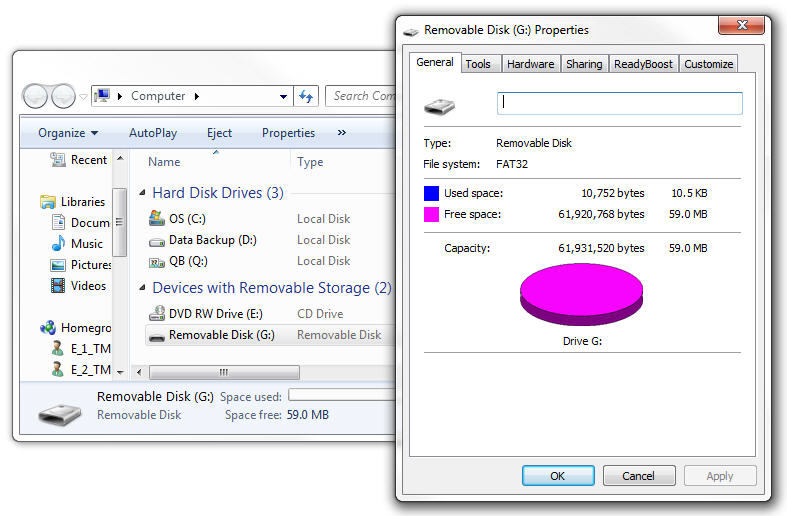
This oscilloscope allows you to save data to an external USB Flash Drive only if the drive is formatted with FAT32.
If you haven't noticed one huge change with Windows 7 is that FAT32 is no longer an option on formatting drives. You are now left with the options of either NTFS or exFAT. OK so your asking what is exFAT? Well its not FAT32, acutally its compatible with FAT64.
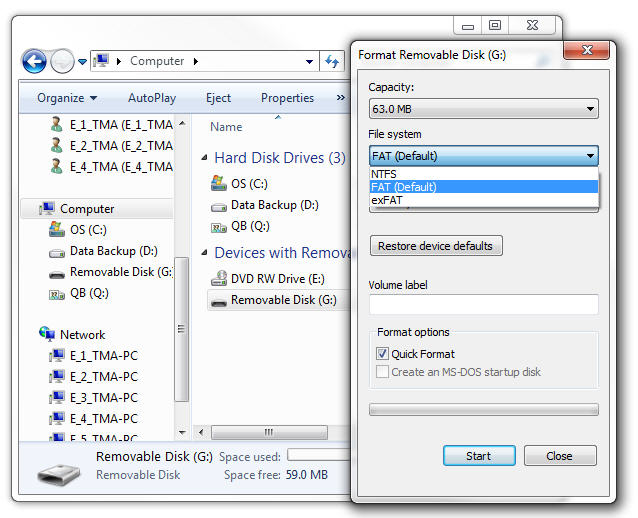
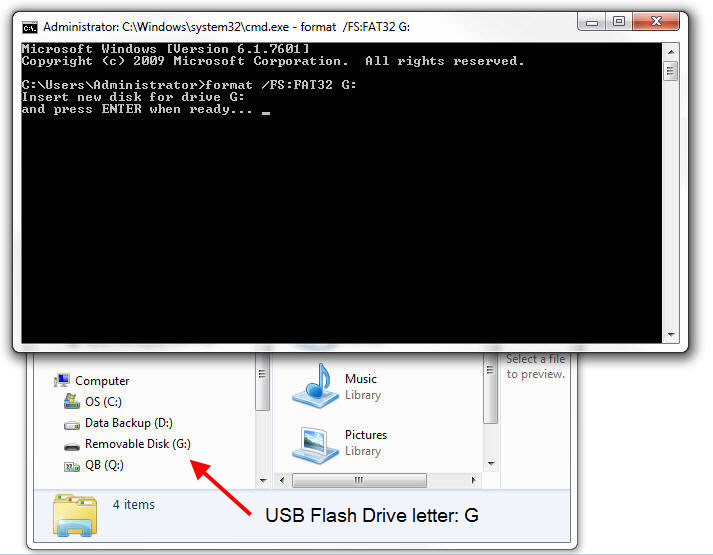
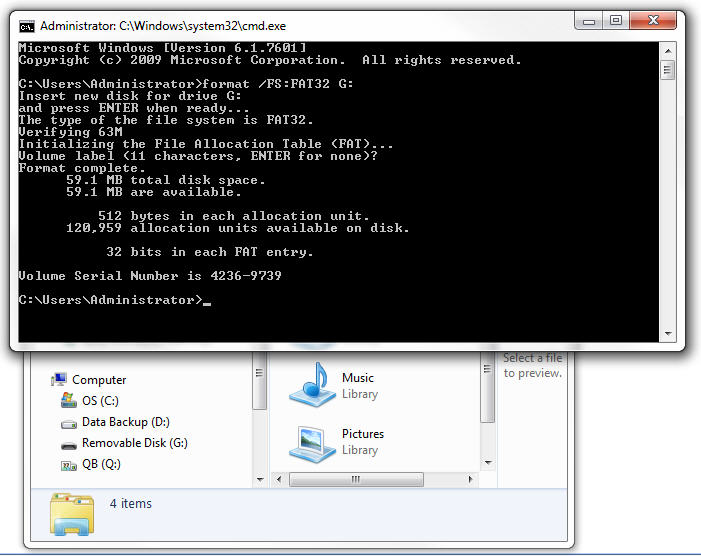
So let's Format external USB Flash drive with FAT32 using DOS
First you need to find what your Hard Drive is named (the label) that is easy to do right click on the hard drive and it will show you in the top box. As you can see mine has no level in the picture bellow. You also need to note which drive letter it is. Mine is Drive: G
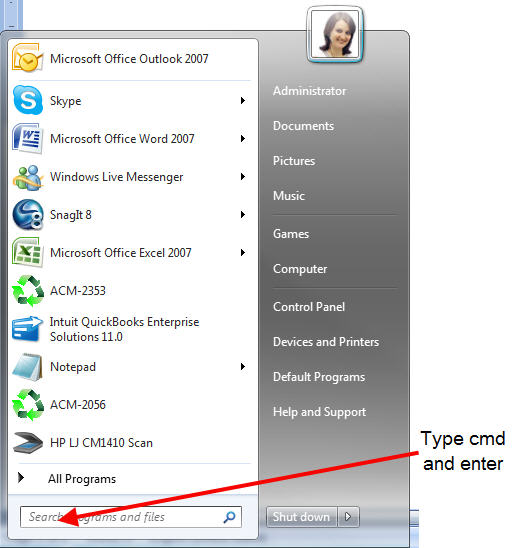
Next thing you need to do is to find your command prompt
Once you get to command prompt you will need to type this:
format /FS:FAT32 G:
Note: You need to change the letter G to the letter of your drive
Then just answer the questions as you like for a volume label, etc. It will take time according to the driver size.
Now for more information of "How to Save and Recall a Waveform details" go to equipment User's Guide or find it by the following links:
For the ADS-2061M go to PDF page 53 (49 if printed) and do not forget that a USB Flash Drive is an external memory. See User's Guide.
For all other ADS models (2022, 2042M, 2061M, 2062 & M, 2102 & M, 2152 & M) go to PDF page 42 (74 if printed) See User's Guide
Check whether Normal or Signal is chosen for Polarity in the TRIG MODE menu and the trigger level exceeds the wave form range. If it is, make the trigger level is centered in the screen or set the trigger mode as Auto. In addition, with the AUTOSET button pressed, the setting above can be completed automatically.
There is wave form displayed, but it is not stable
Check whether the Source item in the TRIG MODE menu is in conformity with the signal channel used in the practical application.
Check on the trigger Type item: The common signal chooses the Edge trigger mode for Type and the video signal the Video. Only if a proper trigger mode is applied, the wave form can be displayed steadily.
Try to change the trigger coupling into the high frequency suppress and the low frequency suppress to smooth the high frequency or low frequency noise triggered by the interference.
AKTAKOM File Converter (AULFConverter) is an utility to convert AKTAKOM data file format used in AKTAKOM applications including APM to other formats such as CSV and WAV.
Designing Off Delay Timer Switch for Water Pump Control
AKTAKOM presents the new slim oscilloscope
El Osciloscopio digital AKTAKOM ADS-2121MV con una pantalla a color TFT LCD de 8" de ancho y una alta velocidad de muestreo en tiempo real de 2GSa/s tiene una gran disponibilidad de memoria y soporte para almacenar mas datos en una memoria Flash USB. La Alta funcionalidad de estos osciloscopios permite una amplia gama de tareas tales como producción, diseño y mantenimiento.