| www.tmatlantic.com
Test & Soldering Equipment On-line Store |
|
D.E.V.I.C.E. (Wiki)Calculators Services |
|||||
Filter by first letter
|
InterpolationInterpolation in digital storage oscilloscopes is continuous signal reconstruction on a limited reports number (samples). Oppositely to analogue oscilloscopes DSOs don’t measure the input signal continuously but in discrete time only. To display an oscillogram the input signal is restored by its discrete values what is considered the interpolation task of the continuous function on its finite number of points. In DSO interpolation is the mathematical treatment of the input digitalized signal by the device software tools. Depending on the mathematical methods used for the interpolation there can be several interpolation types as follows:
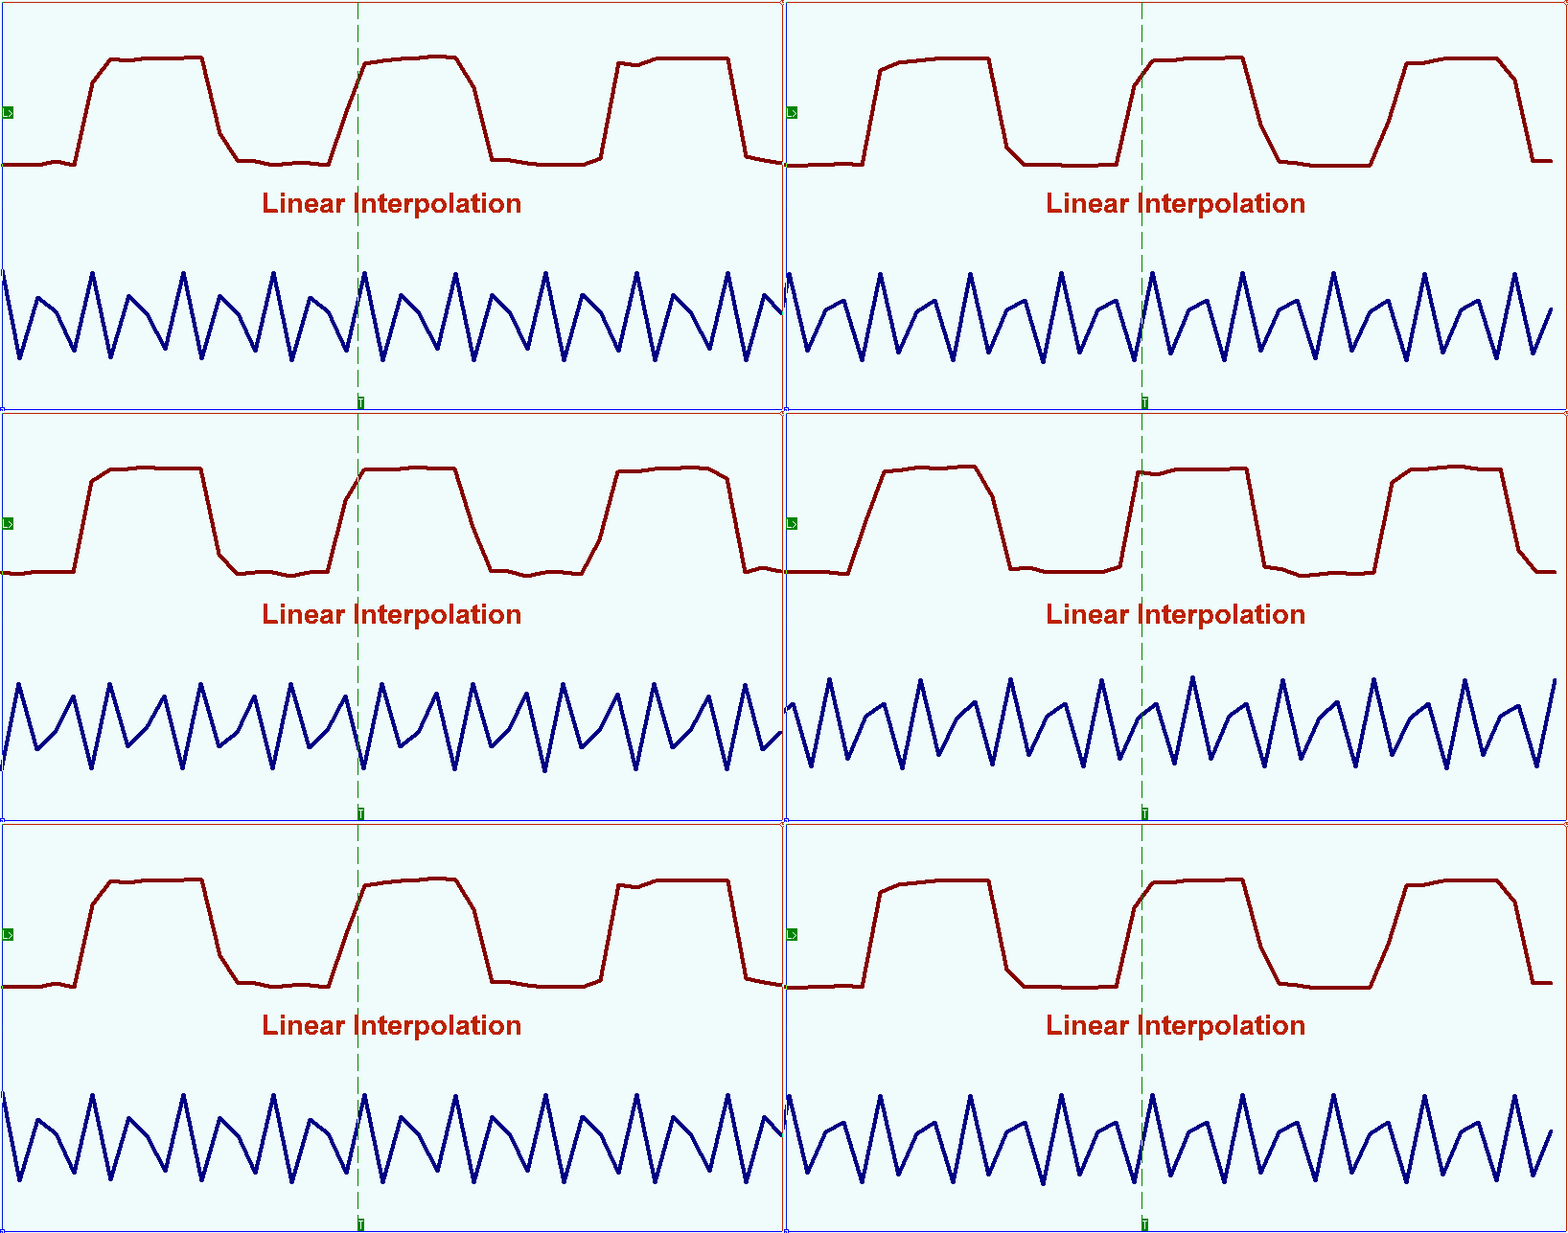
Different interpolation types are shown in the pictures (sine signal with the frequency of 24MHh is sent to the oscilloscope input). At the sample rate (recording) of the device of 100MHz for the one signal period there are 4-5 samples what fails to form the displayed oscillogram as sinus. Linear interpolation for this example is shown in the picture below.
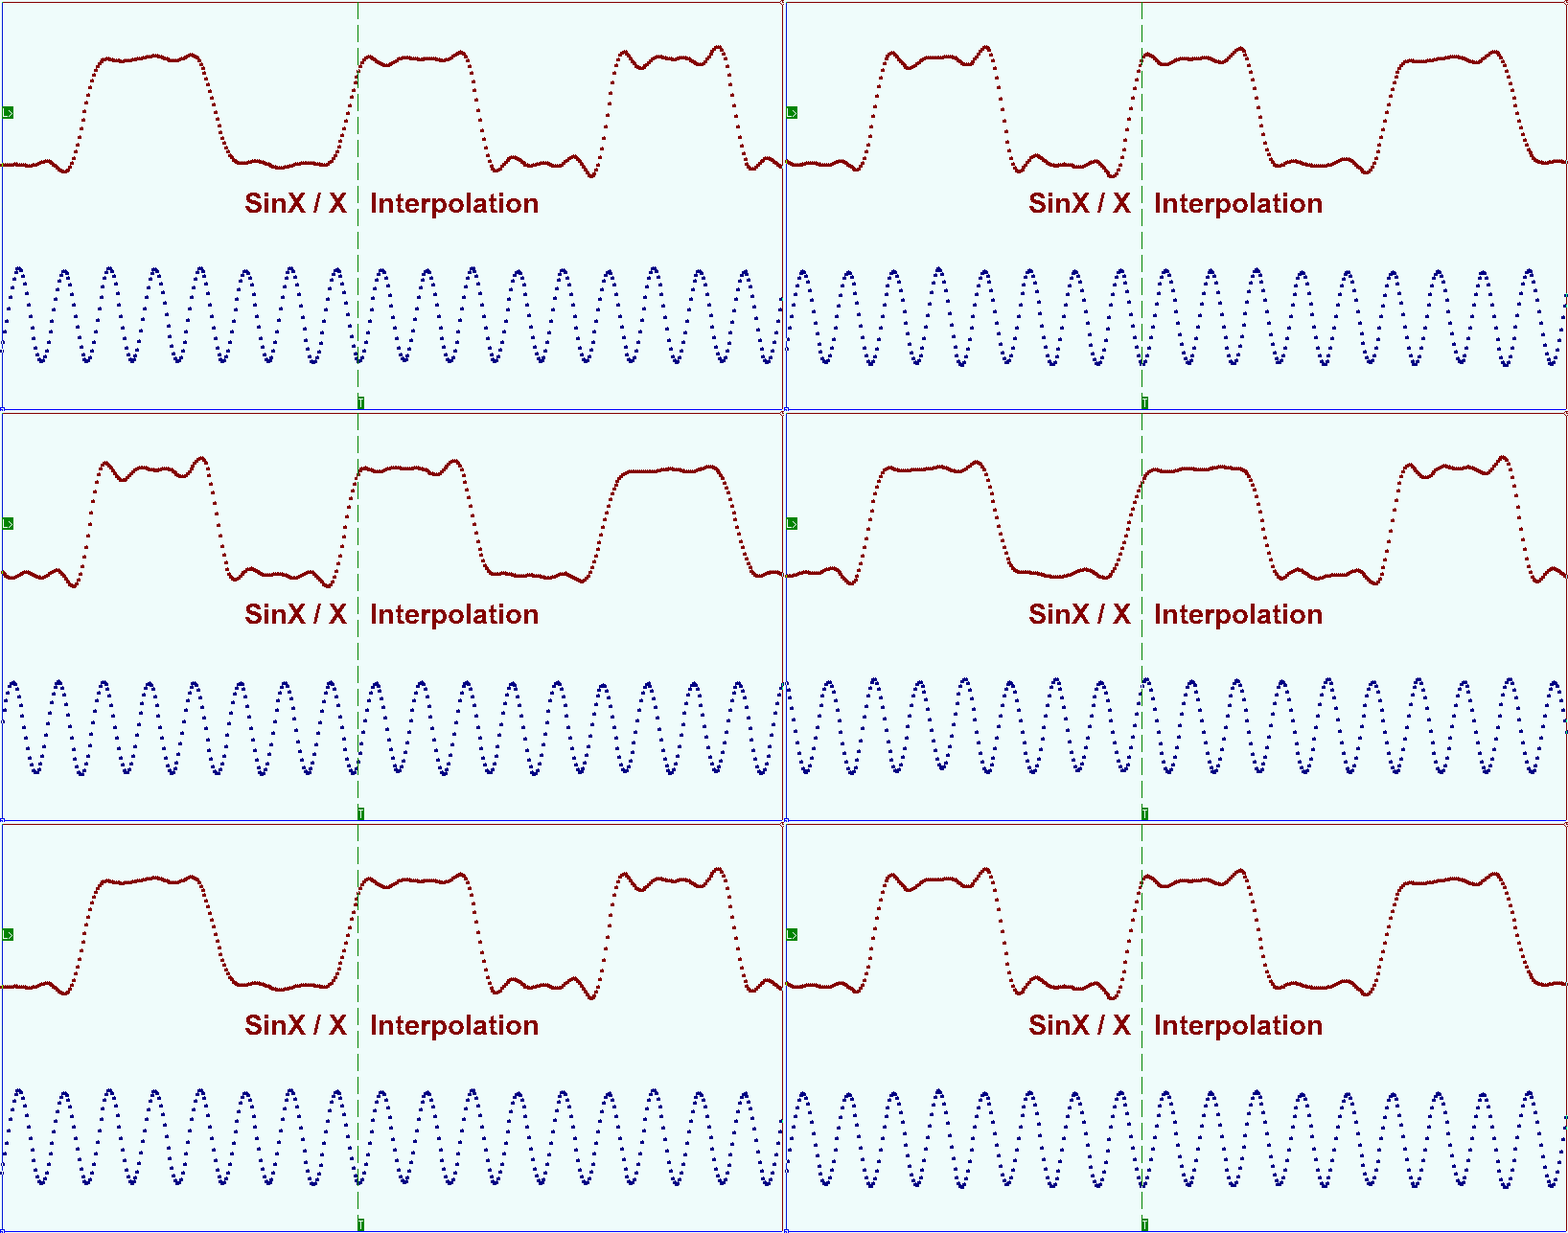
For DSO this playback mode corresponds with the polyline detailed drawing style (Interpolation Off). When DSO works in extreme situations, when the frequency of the registered signal is close to the half of the sample rate, the good result at the signal reconstruction is obtained by (Sin x)/x interpolation. The picture shows the signal oscillogram with the (Sin x)/x interpolation. As you can see the main signal harmonic is fully restored.
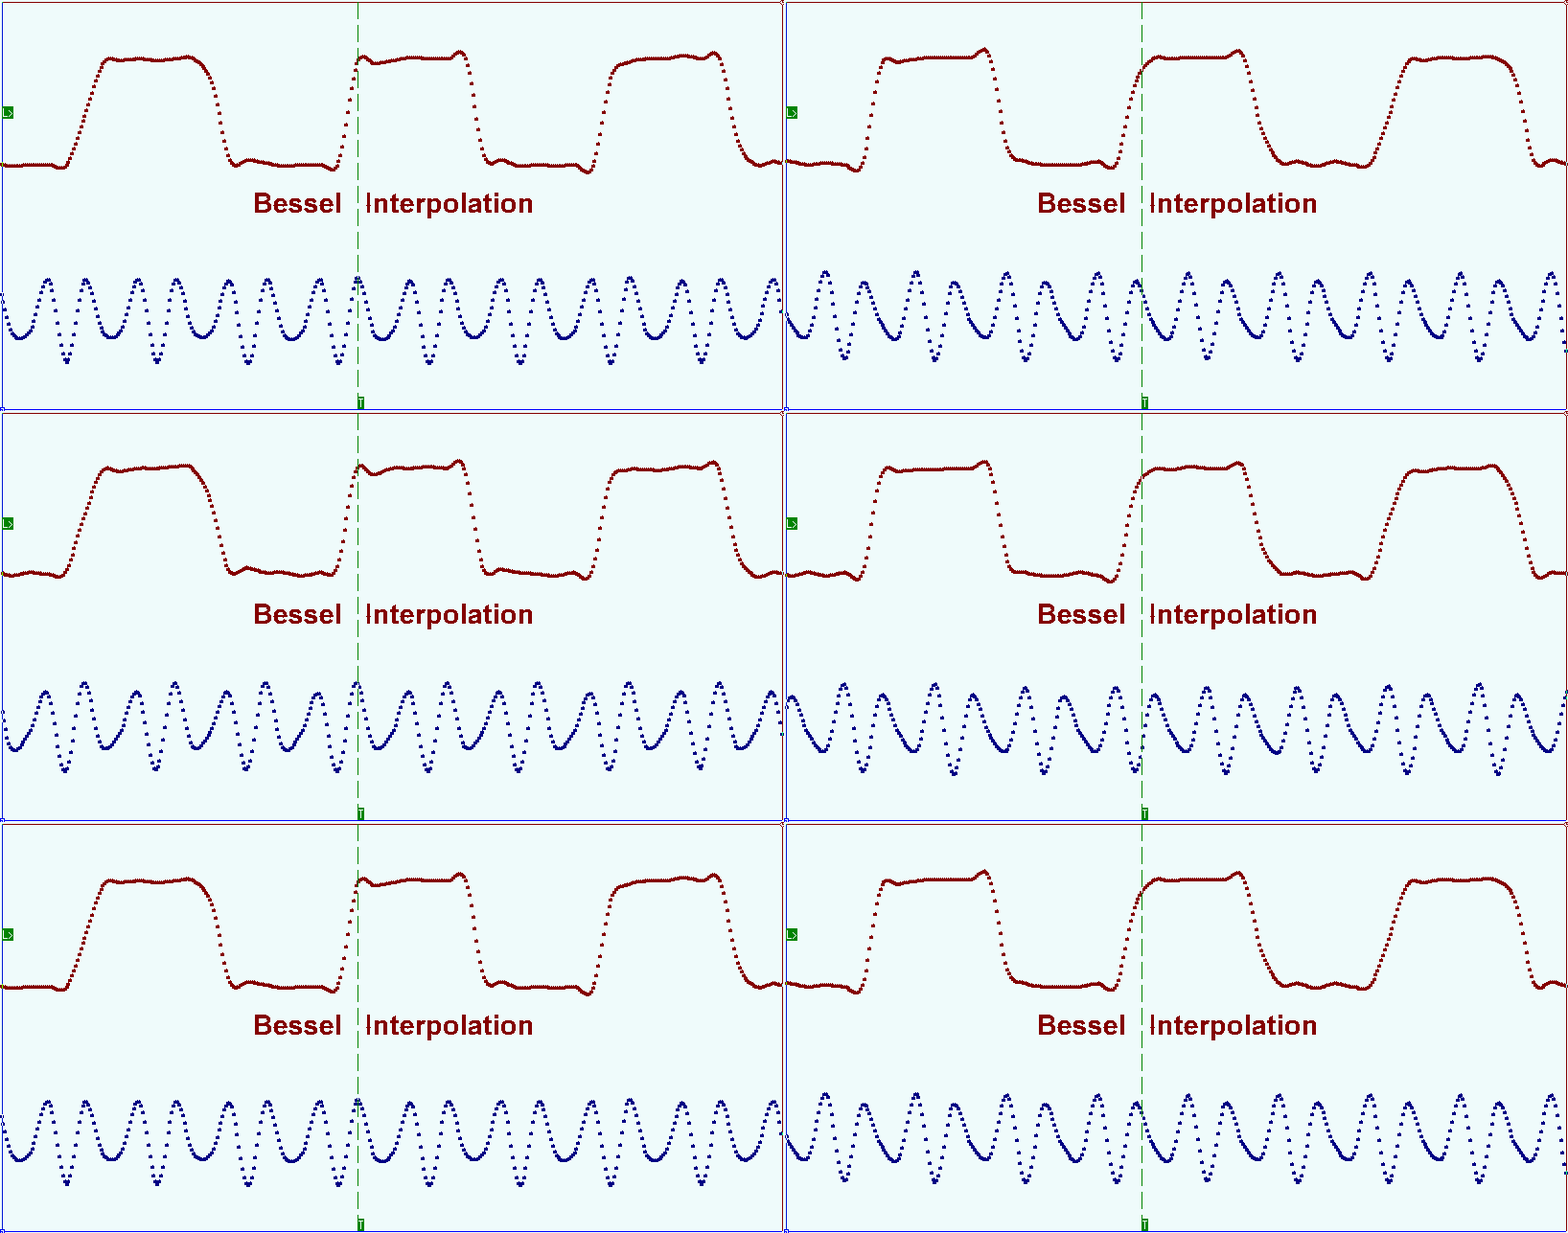
In cases when the number of the samples under registration for the input signal frequency period is too high (dozens or more) spline interpolation can be used. When using this method the interpolation interval is divided into small segments and on each of them a function is set by the cubed polynomial. Polynomial ratios are chosen depending on some certain conditions. The general requirements for all types of tertiary splines are the function continuity and its passing through all points prescribed. Additional requirements can be function linearity between the points of the samples, higher derivatives continuity etc. The picture below shows the pulse waveform oscillogram. Bright points show the samples, the solid line demonstrates the signal reconstruction result on these samples with the Bessel splines interpolation.
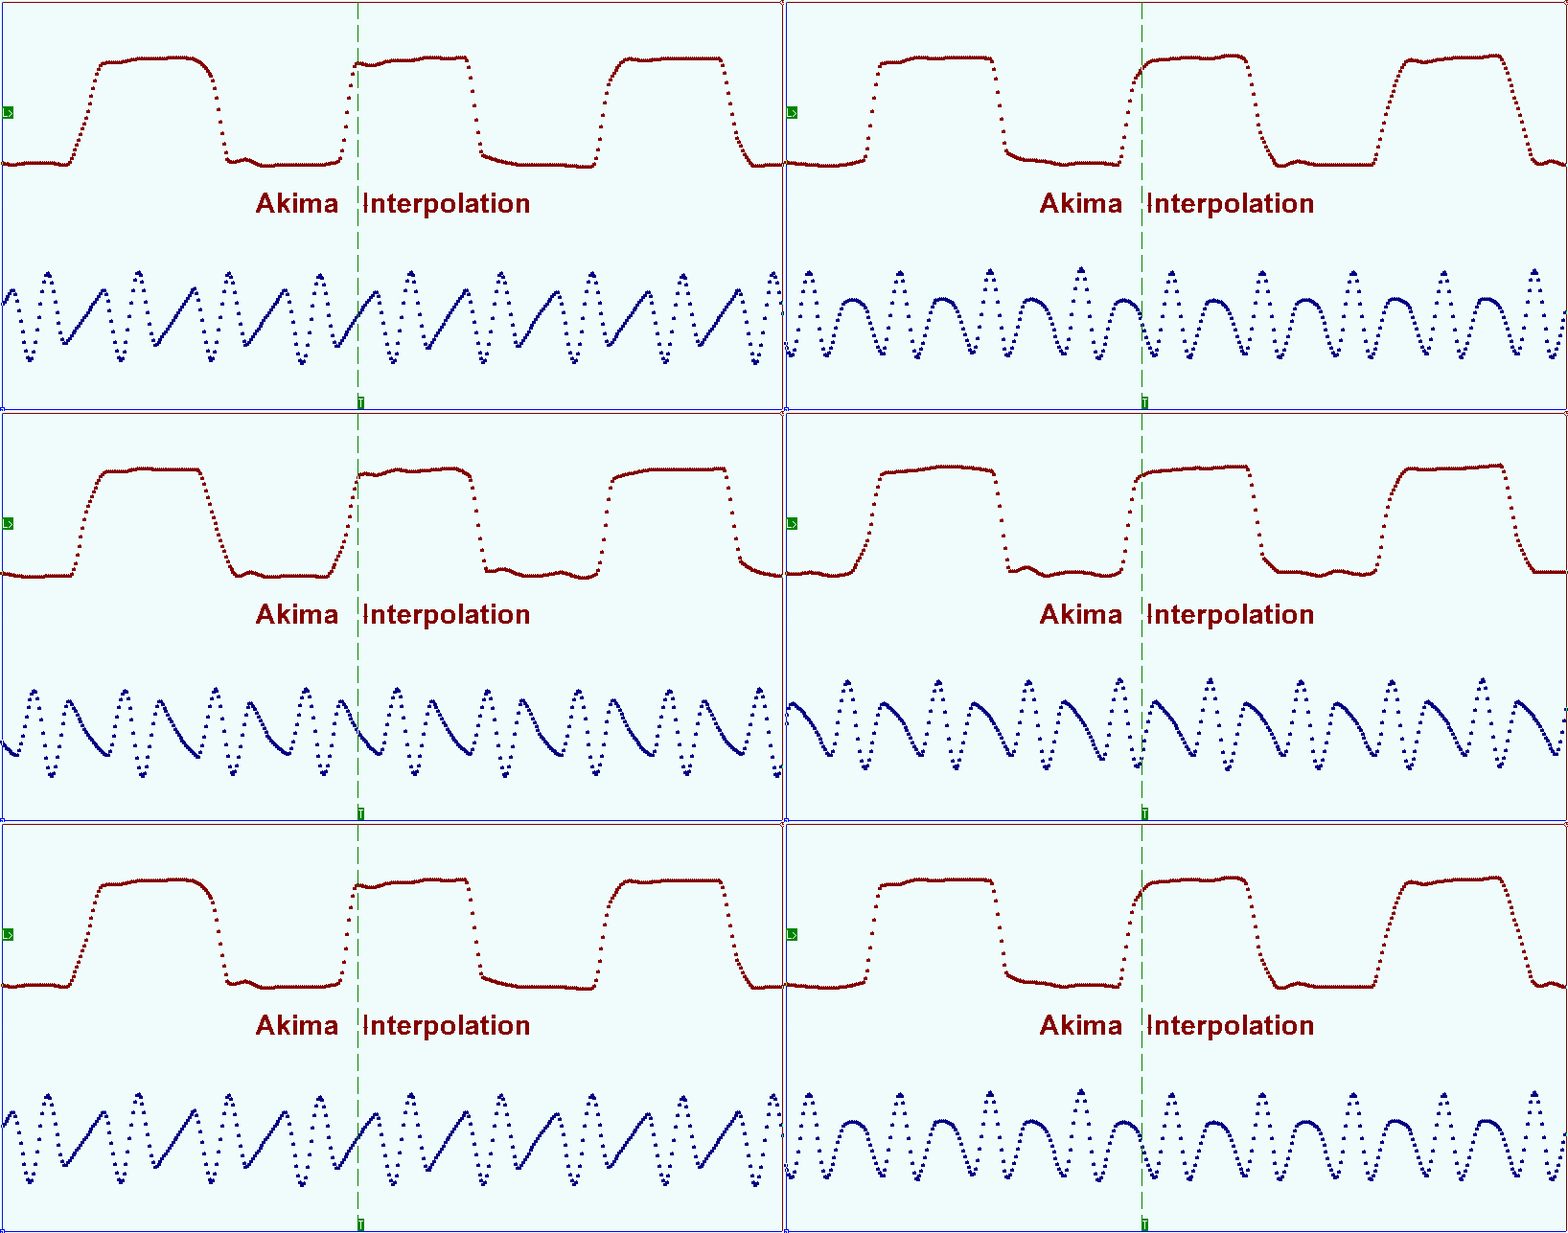
Red circles mark the shoots appeared before the front edge and the falling edge of the displayed signal. Akima splines interpolation method allows minimizing the mentioned distortion. This method takes into account the initial function smoothness on the areas next to the sample points when choosing derivative in these points. The next picture shows the same signal oscillogram with the use of Akima splines interpolation.
La interpolación en osciloscopios de almacenamiento digital es una reconstrucción continua de la señal en un número limitado de reportes (muestras). A diferencia de los osciloscopios analógicos, los DSO no miden la señal de entrada de forma continua sino solo en tiempo discreto. Para visualizar un oscilograma se restituye la señal de entrada por sus valores discretos lo que se considera la tarea de interpolación de la función continua sobre su número finito de puntos. En DSO, la interpolación es el tratamiento matemático de la señal digitalizada de entrada por las herramientas de software del dispositivo. Dependiendo de los métodos matemáticos utilizados para la interpolación, puede haber varios tipos de interpolación, como se indica a continuación:
En las imágenes se muestran diferentes tipos de interpolación (la señal sinusoidal con una frecuencia de 24 MHz se envía a la entrada del osciloscopio). A la frecuencia de muestreo (grabación) del dispositivo de 100 MHz para el período de una señal, hay 4-5 muestras que no forman el oscilograma mostrado como seno. La interpolación lineal para este ejemplo se muestra en la siguiente imagen.
Para DSO, este modo de reproducción se corresponde con el estilo de dibujo detallado de polilínea (Interpolación desactivada). Cuando DSO trabaja en situaciones extremas, cuando la frecuencia de la señal registrada está cerca de la mitad de la frecuencia de muestreo, el buen resultado en la reconstrucción de la señal se obtiene por interpolación (Sin x)/x. La imagen muestra el oscilograma de la señal con la interpolación (Sen x)/x. Como puede ver, el armónico de la señal principal está completamente restaurado.
En los casos en que el número de muestras registradas para el período de frecuencia de la señal de entrada sea demasiado alto (docenas o más), se puede utilizar la interpolación spline. Cuando se utiliza este método, el intervalo de interpolación se divide en pequeños segmentos y en cada uno de ellos se establece una función mediante el polinomio al cubo. Las proporciones polinómicas se eligen dependiendo de ciertas condiciones. Los requisitos generales para todo tipo de splines terciarios son la continuidad de la función y su paso por todos los puntos prescritos. Los requisitos adicionales pueden ser la linealidad de la función entre los puntos de las muestras, la continuidad de derivadas más altas, etc. La siguiente imagen muestra el oscilograma de forma de onda de pulso. Los puntos brillantes muestran las muestras, la línea sólida muestra el resultado de la reconstrucción de la señal en estas muestras con la interpolación de splines de Bessel.
Los círculos rojos marcan los brotes que aparecieron antes del borde frontal y el borde descendente de la señal mostrada. El método de interpolación de splines de Akima permite minimizar la distorsión mencionada. Este método tiene en cuenta la suavidad de la función inicial en las áreas próximas a los puntos de muestra al elegir la derivada en estos puntos. La siguiente imagen muestra el mismo oscilograma de señal con el uso de la interpolación splines de Akima.
|
|
Site mapPrivacy policyTerms of Use & Store PoliciesHow to BuyShippingPayment |


