| www.tmatlantic.com
Test & Soldering Equipment On-line Store |
D.E.V.I.C.E. (Wiki)Calculators Services |
||||||
Filter by first letter
|
Eye diagram
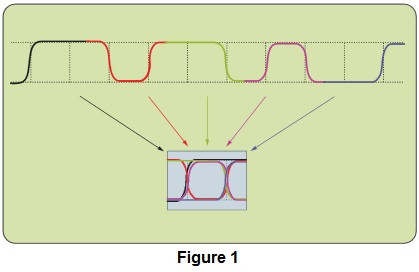
An eye diagram is created when many short segments of a waveform are superimposed such that the nominal edge locations and voltage levels are aligned, as suggested in Figure 1. Usually, a horizontal span of two unit intervals is shown. The waveform segments may be adjacent ones, as shown in the figure, or may be taken from more widely spaced samples of the signal. If the waveform is repeatable, a sampling scope may be used to build an eye diagram from individual samples taken at random delays on many waveforms.
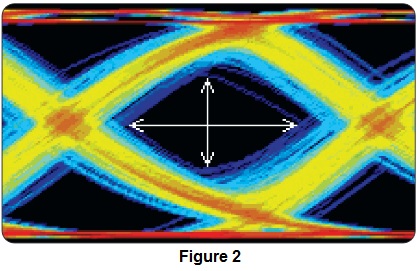
Color has been used in the stylized Figure 1 to show how the individual waveform segments are composed into an eye diagram. In practice, eye diagrams are usually either monochrome or use color to indicate the density of waveform samples at any given point of the display. Figure 2 shows such a color density display for a waveform that exhibits several types of noise.
In this diagram, white arrows are used to show the vertical and horizontal extent of the eye opening. As the noise on a signal increases, the eye becomes less open, either horizontally, vertically or both. The eye is said to be closed when no open area remains in the center of the diagram. The easiest way to create an eye diagram is with an oscilloscope in a long-persistence display mode. You should use caution in how you trigger the scope, if you use this approach. Simply triggering on a waveform edge will result in an eye diagram showing waveforms relative to that edge. This can be very different from an eye diagram relative to the underlying bit clock. To produce a diagram that is relative to the bit clock, you need some form of clock recovery, either in software or hardware. If your oscilloscope does not provide this feature, you may be able to use a trigger derived from an external clock-recovery circuit.
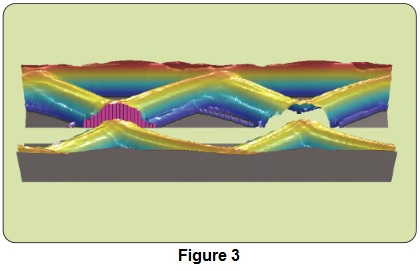
The relationship between the eye diagram and the TIE histogram can be seen by turning the density eye diagram of Figure 2 into a three dimensional figure and slicing it along the decision threshold, as illustrated in Figure 3. The area highlighted in pink is equivalent to a histogram of the first of the two zero-crossings in the eye diagram.
Source: A Guide to Understanding and Characterizing Timing Jitter. Tektronix, www.tek.com |
Units Converter
|


|